Greetings, and thank you in advance for any input.
Currently attempting to test the Manticore (simple demo) docker container integration with Grafana for proof-of-concept purposes before proceeding with a production deployment.
The container was first pulled and ran using the command provided in the docs:
docker run -e EXTRA=1 --name manticore --rm -d manticoresearch/manticore && echo "Waiting for Manticore docker to start. Consider mapping the data_dir to make it start faster next time" && until docker logs manticore 2>&1 | grep -q "accepting connections"; do sleep 1; echo -n .; done && echo && docker exec -it manticore mysql && docker stop manticore
Container comes up with no issues. Created a table and added docs no problem.
However, Grafana keeps throwing an error when trying to connect to the container on the default port via browser.
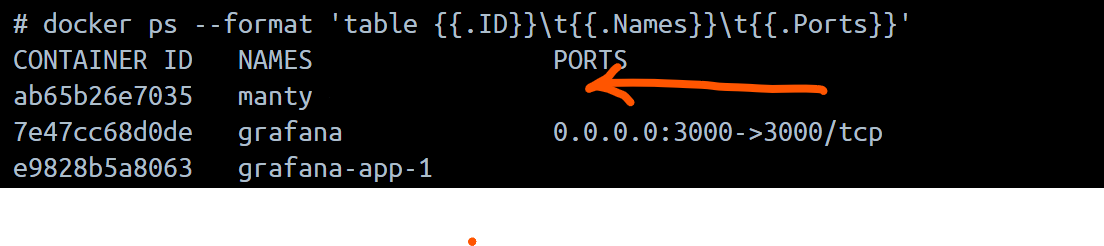
Attempted to to re-deploy the container this time prescribing the port mappings 9306/9308/9312 to ensure they are exposed. The command runs fine and Manticore comes up, but, the issue remains and the port mappings appear to not be taking in the image:
Also, initially when Manticore comes up, the browser view populates a json object stating a parsing error that eventually goes away after a few minutes.
Any feedback would be much appreciated!