Manticore 2.6.4 eating up memory

We recently upgraded our Sphinx 2.2.11 installation to the latest Manticore release and it works so far pretty well. Except one thing: Running Manticore several days, it starts to collect RAM very slowy. I really don’t know, why and what we might got wrong here. I wasn’t brave enough yet, to let it run and see, if there might be a threshold, so after five or six days or so, I restarted the searchd.

What could be the reason for Manticore to stockpile memory? We have only one RT index. It status looks like this:

+-------------------+--------------------------------------------------------------------------------------------------------------+
| Variable_name     | Value                                                                                                        |
+-------------------+--------------------------------------------------------------------------------------------------------------+
| index_type        | rt                                                                                                           |
| indexed_documents | 6415138                                                                                                      |
| indexed_bytes     | 30079168673                                                                                                  |
| ram_bytes         | 1369425609                                                                                                   |
| disk_bytes        | 3557370344                                                                                                   |
| ram_chunk         | 241625732                                                                                                    |
| disk_chunks       | 1                                                                                                            |
| mem_limit         | 1073741824                                                                                                   |
| query_time_1min   | {"queries":86, "avg_sec":0.068, "min_sec":0.005, "max_sec":0.756, "pct95_sec":0.311, "pct99_sec":0.311}      |
| query_time_5min   | {"queries":483, "avg_sec":0.080, "min_sec":0.002, "max_sec":0.756, "pct95_sec":0.251, "pct99_sec":0.321}     |
| query_time_15min  | {"queries":1684, "avg_sec":0.089, "min_sec":0.002, "max_sec":0.824, "pct95_sec":0.404, "pct99_sec":0.640}    |
| query_time_total  | {"queries":197712, "avg_sec":0.082, "min_sec":0.001, "max_sec":19.826, "pct95_sec":0.247, "pct99_sec":0.496} |
| found_rows_1min   | {"queries":86, "avg":20, "min":1, "max":679, "pct95":149, "pct99":149}                                       |
| found_rows_5min   | {"queries":483, "avg":36, "min":0, "max":4109, "pct95":235, "pct99":398}                                     |
| found_rows_15min  | {"queries":1684, "avg":22, "min":0, "max":4109, "pct95":165, "pct99":579}                                    |
| found_rows_total  | {"queries":197712, "avg":33, "min":0, "max":71263, "pct95":47, "pct99":447}                                  |
+-------------------+--------------------------------------------------------------------------------------------------------------+

This is the searchd config:

searchd
{
    # IP address to bind on
    # optional, default is 0.0.0.0 (ie. listen on all interfaces)
    #
    # address               = 127.0.0.1
    # address               = 192.168.0.1

    # searchd TCP port number
    # mandatory, default is 3312
    listen = 127.0.0.1:9306:mysql41

    # log file, searchd run info is logged here
    # optional, default is 'searchd.log'
    log                 = /var/log/sphinx/searchd.log

    # client read timeout, seconds
    # optional, default is 5
    read_timeout        = 5

    # PID file, searchd process ID file name
    # mandatory
    pid_file            = /var/log/sphinx/searchd.pid

    # whether to unlink .old index copies on succesful rotation.
    # optional, default is 1 (do unlink)
    unlink_old          = 1

    binlog_path = /var/data

    collation_libc_locale = de_DE.utf8

    expansion_limit = 16

    attr_flush_period = 1800 # persist updates to disk every 30 minutes
}

And here you can see the memory ramps…

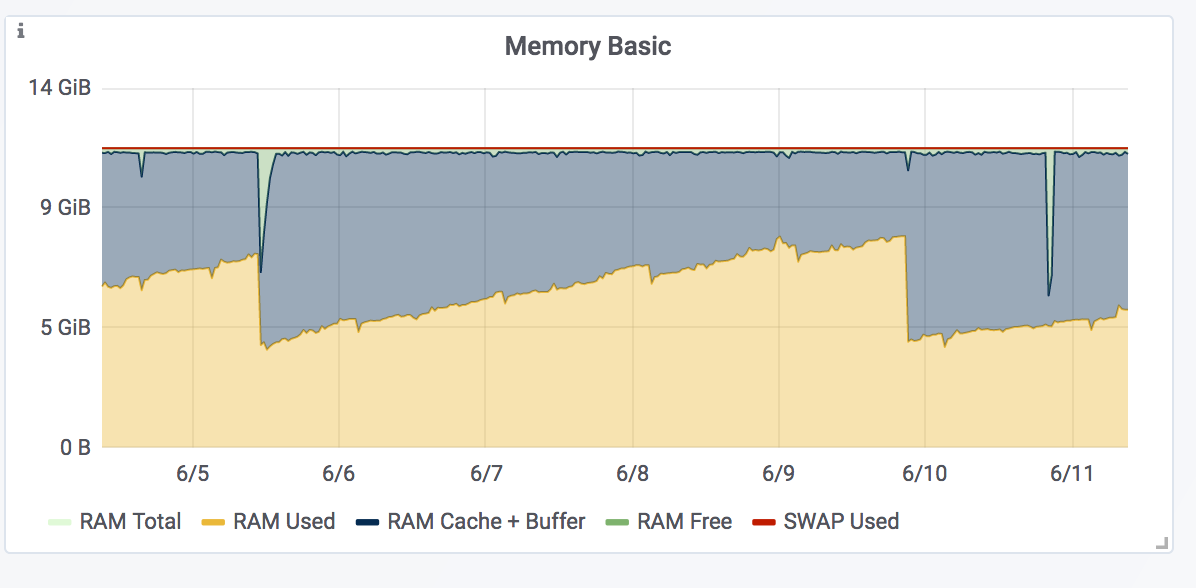
The original sphinx was pretty constant in memory usage and so im curious whats going on here…

Hi,
Anything logged in searchd.log? Can you share the index settings? What type of data operations(insert,update, delete) are made to index during this time ?

Hi!
Thanks for the swift response!

searchd.log has no really interessting information except my shutdowns and restarts. And sometimes there is the saving of a ramchunk:

[Sun Jun 10 07:02:07.150 2018] [5085] rt: index realtime: ramchunk saved ok (mode=periodic, last TID=1039711, current TID=1039715, ram=209.361 Mb, time delta=36003 sec, took=1.943 sec)
[Sun Jun 10 17:02:10.898 2018] [5085] rt: index realtime: ramchunk saved ok (mode=periodic, last TID=1039715, current TID=1040059, ram=226.857 Mb, time delta=36003 sec, took=2.707 sec)
[Mon Jun 11 03:02:16.035 2018] [5085] rt: index realtime: ramchunk saved ok (mode=periodic, last TID=1040059, current TID=1040083, ram=227.084 Mb, time delta=36005 sec, took=3.087 sec)

But nothing suspicious here.

The index configuration looks like this:

index realtime
{
    type = rt
    path = /var/data/realtime

    rt_mem_limit = 1024M

    rt_attr_timestamp   = add_date
    rt_field            = isn
    rt_attr_bigint      = isn_grouper
    rt_field            = cat_number
    rt_field            = author
    rt_attr_string      = author_sort
    rt_field            = title
    rt_attr_string      = title_sort
    rt_field            = title_stopword_optimized
    rt_field            = title_additional
    rt_field            = series
    rt_attr_uint        = year
    rt_field            = signature
    rt_field            = publisher
    rt_field            = content
    rt_attr_uint        = lending_count
    rt_attr_uint        = type_id
    rt_field            = type_cache
    rt_attr_uint        = catalog_id
    rt_attr_uint        = series_id
    rt_attr_uint        = notation_id
    rt_attr_uint        = custom_data
    rt_attr_uint        = custom_data_id
    rt_field            = notation
    rt_field            = sw
    rt_field            = ik
    rt_field            = person
    rt_field            = person_alternatives
    rt_attr_multi_64    = tag
    rt_attr_multi_64    = interesttag

    dict                  = keywords
    morphology            = lemmatize_de, libstemmer_de
    stopwords             = /home/app/sphinx/stopwords.txt
    stopwords_unstemmed   = 1
    min_word_len          = 2
    ignore_chars          = -, U+2D
    charset_table         = 0..9, A..Z->a..z, _, a..z, U+C4->U+E4, U+D6->U+F6, U+DC->U+FC, U+E4, U+F6, U+FC, U+DF
    index_exact_words     = 1
    expand_keywords       = 1
    min_infix_len         = 3
}

Through the day we mostly have “REPLACE INTO”-statements (around 50k-100k per day). But most of them will be updates (80%). The rest splits equally to inserts and deletes.

Could you provide ls -lh of your index files?
What is memory at graphic? Is it VSS or RSS?

Could you provide index status output after daemon start and when memory goes to max?

Could you set worker along with max_children to make sure you do not saturate your box with clients?

Could you provide ls -lh of your index files?

Of course:

-rw------- 1 root      root       30M 12. Jun 13:03 binlog.001
-rw------- 1 root      root         0  9. Jun 21:02 binlog.lock
-rw------- 1 root      root        11 12. Jun 09:02 binlog.meta
-rw------- 1 manticore manticore 418M  5. Jun 11:01 realtime.63.spa
-rw------- 1 manticore manticore 1,7G  5. Jun 11:04 realtime.63.spd
-rw------- 1 manticore manticore  13M  5. Jun 11:04 realtime.63.spe
-rw------- 1 manticore manticore 3,8K  5. Jun 11:04 realtime.63.sph
-rw------- 1 manticore manticore 171M  5. Jun 11:04 realtime.63.spi
-rw------- 1 manticore manticore 1,6M  5. Jun 11:04 realtime.63.spk
-rw------- 1 manticore manticore 246M  5. Jun 11:04 realtime.63.spm
-rw------- 1 manticore manticore 444M  5. Jun 11:04 realtime.63.spp
-rw------- 1 manticore manticore 228M  5. Jun 11:04 realtime.63.sps
-rw------- 1 manticore manticore 302K 12. Jun 09:02 realtime.kill
-rw------- 1 manticore manticore    0  9. Jun 21:01 realtime.lock
-rw------- 1 root      root      3,8K 12. Jun 09:02 realtime.meta
-rw------- 1 root      root      244M 12. Jun 09:02 realtime.ram

What me irritates here are the permissions. Isn’t it necessary to have all files belonging to manticore:manticore?

What is memory at graphic? Is it VSS or RSS?

Ugh… I’m sorry, I don’t know. The output is by prometheus’ node_exporter. I guess it’s RSS.

Could you provide index status output after daemon start and when memory goes to max?

Yes, I will collect them. Now - roughly 24 hours later, it looks like this:

+-------------------+--------------------------------------------------------------------------------------------------------------+
| Variable_name     | Value                                                                                                        |
+-------------------+--------------------------------------------------------------------------------------------------------------+
| index_type        | rt                                                                                                           |
| indexed_documents | 6415918                                                                                                      |
| indexed_bytes     | 30107023907                                                                                                  |
| ram_bytes         | 1431029613                                                                                                   |
| disk_bytes        | 3594085657                                                                                                   |
| ram_chunk         | 303229736                                                                                                    |
| disk_chunks       | 1                                                                                                            |
| mem_limit         | 1073741824                                                                                                   |
| query_time_1min   | {"queries":156, "avg_sec":0.389, "min_sec":0.003, "max_sec":2.051, "pct95_sec":1.740, "pct99_sec":1.939}     |
| query_time_5min   | {"queries":530, "avg_sec":0.193, "min_sec":0.003, "max_sec":2.051, "pct95_sec":0.626, "pct99_sec":1.740}     |
| query_time_15min  | {"queries":1985, "avg_sec":0.126, "min_sec":0.003, "max_sec":2.051, "pct95_sec":0.495, "pct99_sec":1.179}    |
| query_time_total  | {"queries":372917, "avg_sec":0.080, "min_sec":0.001, "max_sec":26.231, "pct95_sec":0.256, "pct99_sec":0.563} |
| found_rows_1min   | {"queries":156, "avg":21, "min":0, "max":1408, "pct95":162, "pct99":289}                                     |
| found_rows_5min   | {"queries":530, "avg":32, "min":0, "max":2573, "pct95":220, "pct99":361}                                     |
| found_rows_15min  | {"queries":1985, "avg":115, "min":0, "max":19964, "pct95":271, "pct99":4025}                                 |
| found_rows_total  | {"queries":372917, "avg":40, "min":0, "max":71263, "pct95":74, "pct99":622}                                  |
+-------------------+--------------------------------------------------------------------------------------------------------------+

Could you set worker along with max_children to make sure you do not saturate your box with clients?

Yes. If nobody has objections I’d update to 2.7.0 today and check if the problem still exists.

Short update: Looks far more stable now after adding max_children and worker. I’ll keep an eye of that and let you know.

Followup: Searchd got killed today:

Jun 18 20:59:16 goethe kernel: Out of memory: Kill process 1610 (searchd) score 454 or sacrifice child
Jun 18 20:59:16 goethe kernel: Killed process 1610, UID 492, (searchd) total-vm:7851044kB, anon-rss:5529056kB, file-rss:140kB

What can I do, to prevent this?

that interval is too long. We need to setup script that dumps index status output with 10-30 minute interval and dumps RSS of daemon process to line up these numbers.
I also worth to counter INSERT \ REPLACE \ UPDATE \ search operations and dump these counters regular along with previous data.
With this data we might narrow down what cause memory consumption.
It case memory issue from particular search or INSERT you might create locally reproducible example.

We also might rebuild daemon with DEBUG_LEAK enabled option however daemon will be very slow this way and logs alot of data. That is why it worth to get initial investigation results then setup daemon with DEBUG_LEAK enabled option as blackhole agent at another box and check memory issue there.

I’ve prepared a logfile over this weekend with index status output and the memory usage. Are you coming along with this or should I format this for a better usage?

https://www.dropbox.com/s/p8t8s03spch8b3p/manticore.log?dl=0

I’ve integrated a counter for operations send to manticore, but as you can see, those are not that wild. A lots of SELECTS, some SHOW METAs and very few REPLACES and DELETES.

I can export you more detailed information on this, if needed.

From log file you provided I see that RSS got increased from 2Gb to 4.5Gb however SHOW INDEX STATUS reports almost same RAM usage. That seems like memory leak.
To make sure what is command line you issue to get ps of searchd ?

Could you provide data that reproduces that case here locally to our write only FTP?

ftp: dev.manticoresearch.com
user: manticorebugs
pass: shithappens

I need query log file with SphinxQL format for time you get that log - from 2018-06-22 16:28:34 to 2018-06-25 10:30:00. Index files along with config and stopwords.txt file.

I’d like to replay queries from query log and check searchd memory consumption then narrow down search to any query that cause that leak.

I’m using smem for the ram output: smem --processfilter="^/usr/bin/searchd"

At the moment, there is no query log file, but as this is an ongoing problem, I will now create another sample set now for the upcoming ~24 hours.

Btw.: Is it normal, that the query log only includes SELECT queries? Or am I missing something? I can’t find any REPLACE or DELETE queries…

yes only selects log to query.log file

I’m not sure if I’m doing something wrong, but:

put: /Users/gerricom/Desktop/Manticore/gerricom_manticore_memoryleak.tar.xz: Access failed: 550 gerricom_manticore_memoryleak.tar.xz: Operation not permitted

You can download the data now here: https://upload.eopac.de/f.php?h=2RBdZzIr

Has anybody had time to investigate our problem? Should I open a ticket at github? The problem isn’t getting any better. I integrated a searchd-restart into our nightly cleanup-script, but this feels not like a good solution…

You have to create folder at FTP prior to upload - that said FTP in its description.

I downloaded archive you provided and see query log along with index however now I see no log file with index status output and the daemon memory usage.
I going to replay queries from query.log you provided vs index file you provided and watch for memory consumption of daemon.

However I could be better that you prepare complete example query log along with index status output and the daemon memory usage for same period of time. I need to line up these logs along each other to see what queries cause memory consumption by daemon and how much.

You also might create ticket at github to track issue progress.

I’ve reproduced this leak with data you provided and created ticket 91 at github issue tracker. You might subscribe there and get informed when issue got fixed.