So if have around 10 GB of data indexed in a rt_index, how much data out of 10 GB will be loaded to the RAM when I start searchd . Is there any way I can find out how much data is loaded to the RAM in the beginning?
Sum up the size of index files of this type for RT index .ram , .kill, .spa, .spb, .spi, .spk, .spm, .sphi, .spt
These files types for Manticore version 3 - for previous version you could find files list at doc topic indexing/indexes.html#index-files.
ie daemon loads all files into memory but keep on disk document list and keywords positions
@tomat Do you recommend to use swap space?
not quite clear what is swap space - we already use mmap sys call to manages files that loads into memory that is why it already might cached out from real RAM by OS
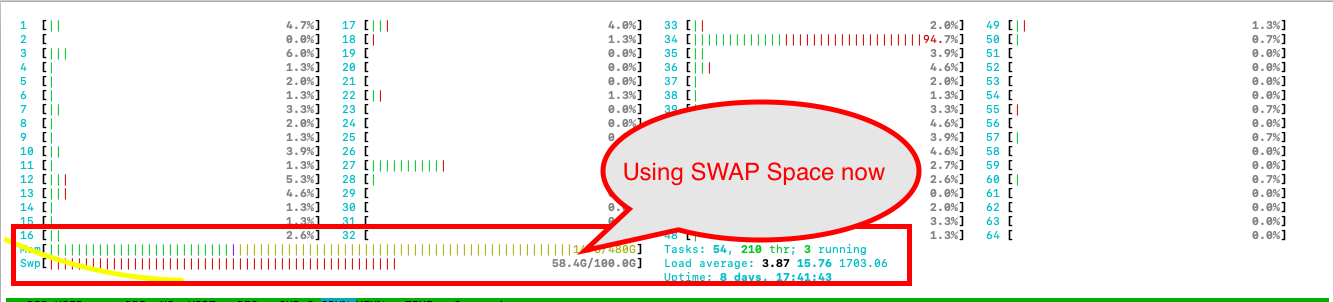
In the above image, the system is using 36% for RAM and remaining is cached and we can see it use 58% of Swap. We have total 650GB data in index folder (RT index). Will it affect the performance of the search ?
What is the ideal RAM size we are supposed to use?
you have to calculate it as I describe it in 1st reply.
You also might to issue optimize command for you RT index to lower count of disk chunk and remove duplicated data from you RT index.
in case you have your RT index loaded as I see that you have swap used you might issue
mysql>SHOW INDEX rt_name STATUS;
and it will show you ram_bytes - that is how many RAM used this index
mysql> SHOW INDEX rt_index STATUS;
+-------------------+----------------------------------------------------------------------------------------------------------+
| Variable_name     | Value                                                                                                    |
+-------------------+----------------------------------------------------------------------------------------------------------+
| index_type        | rt                                                                                                       |
| indexed_documents | 1433943                                                                                                  |
| indexed_bytes     | 904065528                                                                                                |
| ram_bytes         | 1545098816                                                                                               |
| disk_bytes        | 1755151504                                                                                               |
| ram_chunk         | 907529485                                                                                                |
| disk_chunks       | 1                                                                                                        |
| mem_limit         | 1073741824                                                                                               |
| ram_bytes_retired | 0                                                                                                        |
| query_time_1min   | {"queries":74, "avg_sec":0.000, "min_sec":0.000, "max_sec":0.032, "pct95_sec":0.032, "pct99_sec":0.032}  |
| query_time_5min   | {"queries":208, "avg_sec":0.000, "min_sec":0.000, "max_sec":0.032, "pct95_sec":0.019, "pct99_sec":0.032} |
| query_time_15min  | {"queries":246, "avg_sec":0.002, "min_sec":0.000, "max_sec":0.121, "pct95_sec":0.031, "pct99_sec":0.121} |
| query_time_total  | {"queries":413, "avg_sec":0.004, "min_sec":0.000, "max_sec":0.175, "pct95_sec":0.016, "pct99_sec":0.073} |
| found_rows_1min   | {"queries":74, "avg":0, "min":0, "max":1, "pct95":1, "pct99":1}                                          |
| found_rows_5min   | {"queries":208, "avg":0, "min":0, "max":13, "pct95":1, "pct99":13}                                       |
| found_rows_15min  | {"queries":246, "avg":0, "min":0, "max":13, "pct95":1, "pct99":13}                                       |
| found_rows_total  | {"queries":413, "avg":0, "min":0, "max":13, "pct95":1, "pct99":3}                                        |
+-------------------+----------------------------------------------------------------------------------------------------------+
17 rows in set (0.03 sec)

mysql> OPTIMIZE INDEX rt_index;
Query OK, 0 rows affected (0.00 sec)

mysql> SHOW INDEX rt_index STATUS;
+-------------------+----------------------------------------------------------------------------------------------------------+
| Variable_name     | Value                                                                                                    |
+-------------------+----------------------------------------------------------------------------------------------------------+
| index_type        | rt                                                                                                       |
| indexed_documents | 1433943                                                                                                  |
| indexed_bytes     | 904065528                                                                                                |
| ram_bytes         | 1545098816                                                                                               |
| disk_bytes        | 1755151504                                                                                               |
| ram_chunk         | 907529485                                                                                                |
| disk_chunks       | 1                                                                                                        |
| mem_limit         | 1073741824                                                                                               |
| ram_bytes_retired | 0                                                                                                        |
| query_time_1min   | {"queries":99, "avg_sec":0.000, "min_sec":0.000, "max_sec":0.014, "pct95_sec":0.003, "pct99_sec":0.003}  |
| query_time_5min   | {"queries":295, "avg_sec":0.000, "min_sec":0.000, "max_sec":0.032, "pct95_sec":0.012, "pct99_sec":0.032} |
| query_time_15min  | {"queries":345, "avg_sec":0.001, "min_sec":0.000, "max_sec":0.121, "pct95_sec":0.030, "pct99_sec":0.121} |
| query_time_total  | {"queries":512, "avg_sec":0.003, "min_sec":0.000, "max_sec":0.175, "pct95_sec":0.013, "pct99_sec":0.051} |
| found_rows_1min   | {"queries":99, "avg":0, "min":0, "max":0, "pct95":0, "pct99":0}                                          |
| found_rows_5min   | {"queries":295, "avg":0, "min":0, "max":13, "pct95":1, "pct99":13}                                       |
| found_rows_15min  | {"queries":345, "avg":0, "min":0, "max":13, "pct95":1, "pct99":13}                                       |
| found_rows_total  | {"queries":512, "avg":0, "min":0, "max":13, "pct95":1, "pct99":2}                                        |
+-------------------+----------------------------------------------------------------------------------------------------------+
17 rows in set (0.00 sec)
If you see, After we run mysql> OPTIMIZE INDEX rt_index; none of the numbers changed . Also i found ram_chunk is a big number . Any suggestion ?
disk_chunks 1 already shows that you have only one disk chunk.
Seems you have big index. You might use ondisk \ mmap option to keep more parts of that index at disk.
However it could be better to provide box RAM, list of index files with its sizes and describe more on issue you have as currently I see no issues here.
@tomat Thank you
We have also has troubles with high RAM consumption. Our disk index is 3.6 GB. searchd starts up at about 3 GB of RAM, and under production load progresses to 6-10 GB. However, the server has occasionally locked up with searchd spiking at 30 GB RAM. Is this usage expected (and we just need to upgrade the machine), or is something going wrong here?
in case you will provide more details it might be easier to check your case
Manticore 3.2.2 under docker. Our documents (2,230,000) are music lyrics, mostly English, but some in a variety of other languages. There are a lot of attributes:
-
sql_attr_uint: 19 -
sql_attr_float: 5 -
sql_attr_bool: 35 -
sql_field_string: 14 - most under 20 chars
The index has:
morphology           = stem_en
min_prefix_len       = 1
index_exact_words    = 1
bigram_index         = both_freq
And searchd:
listen_backlog     = 32
subtree_docs_cache = 4M
subtree_hits_cache = 8M
workers            = thread_pool
dist_threads       = 2
net_workers = 2What’s not clear:
- plain or RT indexes?
- what’s rt_mem_limit ?
-
ls -laof index files would be useful
@mng first upgrade to latest (3.4.2). For plain indexes there is an increase of memory during rotation (as there are 2 copies of index loaded), but searchd should not spike to such levels (30GB at 3.6GB index), could be a memory leak. Also check with SHOW THREADS if there are very long queries.
Thanks for the feedback, we will work on upgrading our manticore instance.
I am uncertain regarding when RAM usage is high (will try to capture on next occurrence). In general, queries take 0.2s, with the occasional running for 30s.
They are plain (disk) indexes. rt_mem_limit is not set in the config file.
# ls -la
total 3688848
drwxr-xr-x 1 5029 5029        624 May 27 01:28 .
drwxr-xr-x 1 root root         14 May 20 14:58 ..
-rw------- 1 root root          8 May 27 01:28 binlog.001
-rw------- 1 root root          0 May 20 14:59 binlog.lock
-rw------- 1 root root         11 May 27 01:28 binlog.meta
-rw------- 1 root root          0 May 20 14:59 dummyindex.lock
-rw------- 1 root root        320 May 19 14:48 dummyindex.meta
-rw------- 1 root root         20 May 19 14:48 dummyindex.ram
-rw-r--r-- 1 root root     432908 May 27 01:28 products.spa
-rw-r--r-- 1 root root     834895 May 27 01:28 products.spb
-rw-r--r-- 1 root root    2970765 May 27 01:28 products.spd
-rw-r--r-- 1 root root      75457 May 27 01:28 products.spe
-rw-r--r-- 1 root root        503 May 27 01:28 products.sph
-rw-r--r-- 1 root root      13325 May 27 01:28 products.sphi
-rw-r--r-- 1 root root     111200 May 27 01:28 products.spi
-rw------- 1 root root          0 May 27 01:28 products.spl
-rw-r--r-- 1 root root       1904 May 27 01:28 products.spm
-rw-r--r-- 1 root root     979176 May 27 01:28 products.spp
-rw-r--r-- 1 root root      79699 May 27 01:28 products.spt
-rw------- 1 root root         53 May 20 14:59 sphinxvars.sql
-rw-r--r-- 1 root root  272836920 May 27 01:24 text.spa
-rw-r--r-- 1 root root  654914568 May 27 01:24 text.spb
-rw-r--r-- 1 root root 1288221360 May 27 01:28 text.spd
-rw-r--r-- 1 root root   35316922 May 27 01:28 text.spe
-rw-r--r-- 1 root root      21663 May 27 01:28 text.sph
-rw-r--r-- 1 root root     101757 May 27 01:24 text.sphi
-rw-r--r-- 1 root root    6266535 May 27 01:28 text.spi
-rw------- 1 root root          0 May 27 01:28 text.spl
-rw-r--r-- 1 root root     279836 May 27 01:24 text.spm
-rw-r--r-- 1 root root 1502398272 May 27 01:28 text.spp
-rw-r--r-- 1 root root   11718011 May 27 01:24 text.spt
Upgraded to Manticore 3.4.2 69033058@200410 release. After three days of running, memory usage has increased to:
   PID USER      PR  NI    VIRT    RES    SHR S  %CPU %MEM     TIME+ COMMAND
 13522 root      20   0 11.364g 0.010t 937.7m S   6.9 26.9 162:05.82 searchd
If you didn’t reindexed with 3.4.2 do it and also check with indextool the indexes (so they don’t have an apparent corruption), also query logging should be enabled with sphinxql log format - if it’s a memory leak it should be created by some type of query. The easiest way of debugging is to have the indexes and replay the query log. Also does memory keeps growing or gets released from time to time?
Index was reindexed, and indextool reports no error. Watching in top, memory usage does fluctuate up and down a bit while queries are running. However the overall trend is upwards. I replayed a log of production queries in development (had to do some cleaning sed 's/@weight/weight\(\)/'), and confirmed the memory increase. After completing sending all queries to searchd, memory usage dropped a little (~50 MB), and is now staying constant (no new queries are being sent to it).
Is there any further debugging that would be useful? Shall I create an issue on github?